How to Read Candlestick Charts
Contact: info@volatron.com
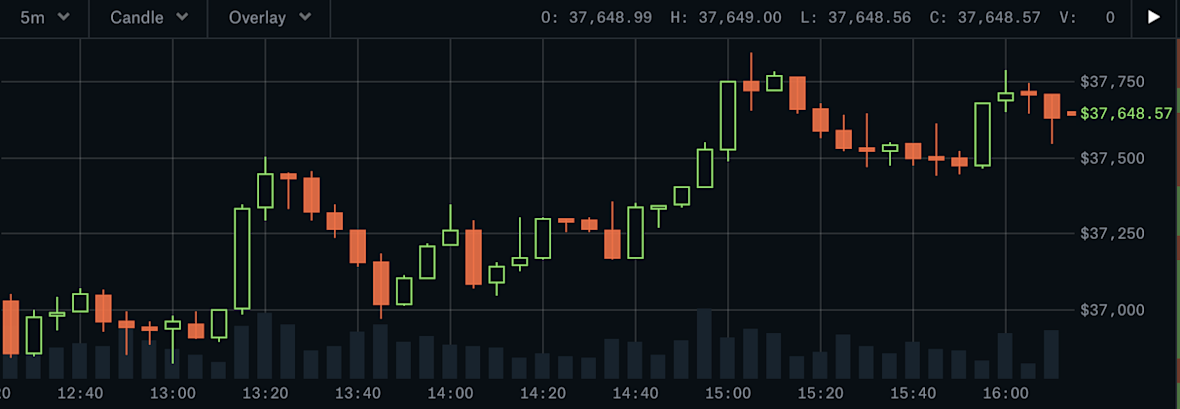
Candlestick charts are like special picture stories that show how prices of things like stocks or Bitcoin change over time. They look a little bit like candles, which is how they got their name!
What Makes Up a Candlestick?
Each candlestick tells us what happened during a specific time, like one hour or one day. It has three main parts:
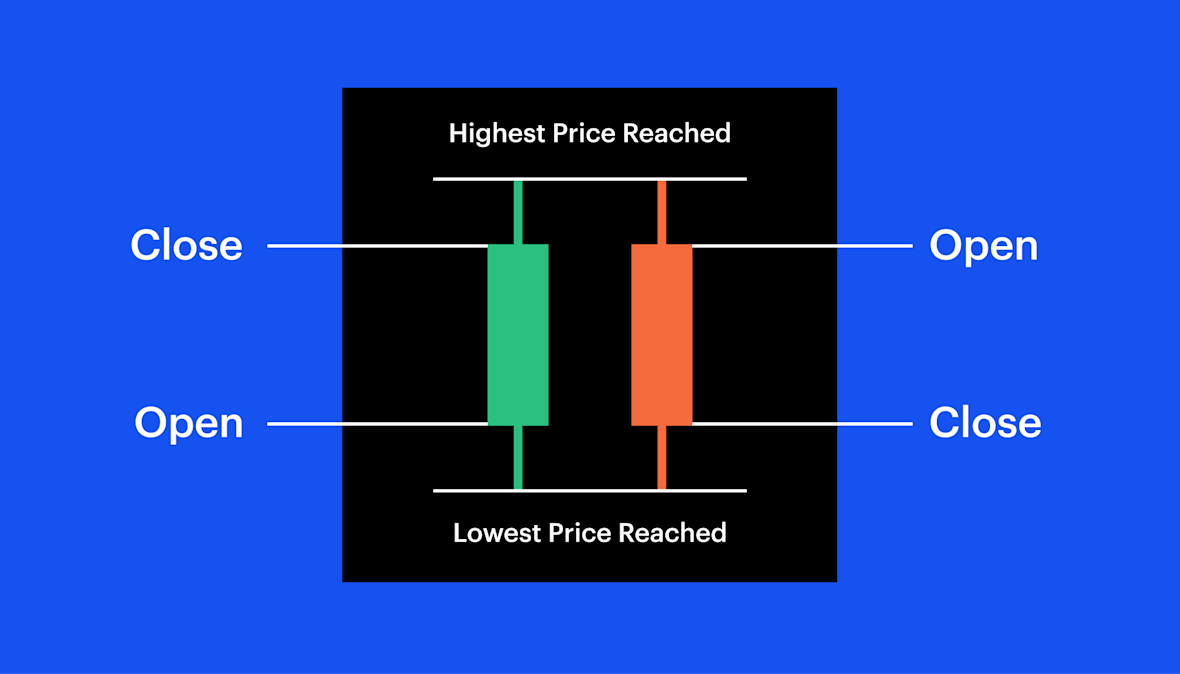
Body: The thick part of the candle shows the starting price and ending price for that time period.
Wick: The thin lines above and below the body show the highest and lowest prices during that time.
Color: The color tells us if the price went up or down!
What Do the Colors Mean?
Candlesticks are usually green and red . Here's what they tell us:
Green Candle: This means the price went UP! The bottom of the body shows the starting price, and the top shows the ending price. It's like the candle grew taller!
Red Candle: This means the price went DOWN! The top of the body shows the starting price, and the bottom shows the ending price. It's like the candle got shorter!

Reading the Story
When you look at a chart with many candlesticks, you're reading a story about how people feel about something like Bitcoin. Here's how to understand it:
Long green candles: Lots of people are excited and want to buy! The price is going up quickly.
Long red candles: Lots of people are worried and want to sell! The price is going down quickly.
Short candles: Not much is happening. People are unsure, so the price isn't changing much.
Long wicks: This means people tried to push the price up or down, but it didn't stay there. It's like a tug-of-war!

Why Are Candlestick Charts Useful?
Candlestick charts help us see quickly how prices are changing without having to read lots of numbers. They're like a secret code that, once you understand it, tells you a story about what people are buying and selling!
Remember: Candlestick charts are tools that help us understand what happened in the past. They can't tell us for sure what will happen in the future, just like how a weather report can't guarantee tomorrow's weather!
Next time you see a candlestick chart, try to read the story it tells. Are people excited or worried? Is the price going up or down? With practice, you'll get better at understanding these special picture stories!